Blog
Insights
Context Over Quantity: Stop Doing V-Lookups at Scale
Your GTM motion needs data that thinks in dimensions, not columns. Stop doing V-lookups at scale. Your RevOps teams, your SDRs, your agents – hell, I’ll say even your prospects – all deserve better.

Sam Featherstone
VP of GTM

It’s 2026. You need to define your ICP. RevOps teams need to move beyond running V-lookups across ten spreadsheets—or relying on outdated SaaS platforms that are merely V-lookup spreadsheets in disguise. There is a much better way to nail that ICP.
The problem isn’t effort. Your Revops staff are some of the hardest working people in your company. If it were an effort problem, your Sales team would be drowning in hot leads.
The problem is architecture. Spreadsheets are 2D. And we live in a 3D world.
2D data architecture (defined here as data that is built on rigid rows, columns, and joins) does not support context. Flat data limits RevOps’ ability to define, in an exact way, what your ICP is at that moment. Your ICP isn’t flat, so why define your ICP on flat, point-in-time data?
Incidentally, your AI agents don’t think in spreadsheets, either. They don’t think in rows and columns. They think in a neural network framework and, using modern technology like an MCP Server, they can make great decisions based on a whole lot of unstructured data.
So if you are working in a 2D world, you are bringing a spreadsheet knife to a neural network gunfight.
The NAICS Code Tax
Legacy data platforms are running a 2004 playbook. This is no surprise: many of them are built on a tech stack that pre-dates the iPhone. CEOs are bailing out left and right. Their stock prices are down by 50% or more.
And yet. The playbook hasn’t changed. Fundamentally, legacy data platforms:
Store data in tables.
Let users set up to 7 filters.
Return a list.
For example, say you want to vibe-code an internal agent to surface a pitch-perfect list of hot prospects to your Sales team. Every morning, you want to give them a live, constantly updated feed of B2B SaaS companies whose buyers will actually take the call (aka Salesperson’s nirvana).
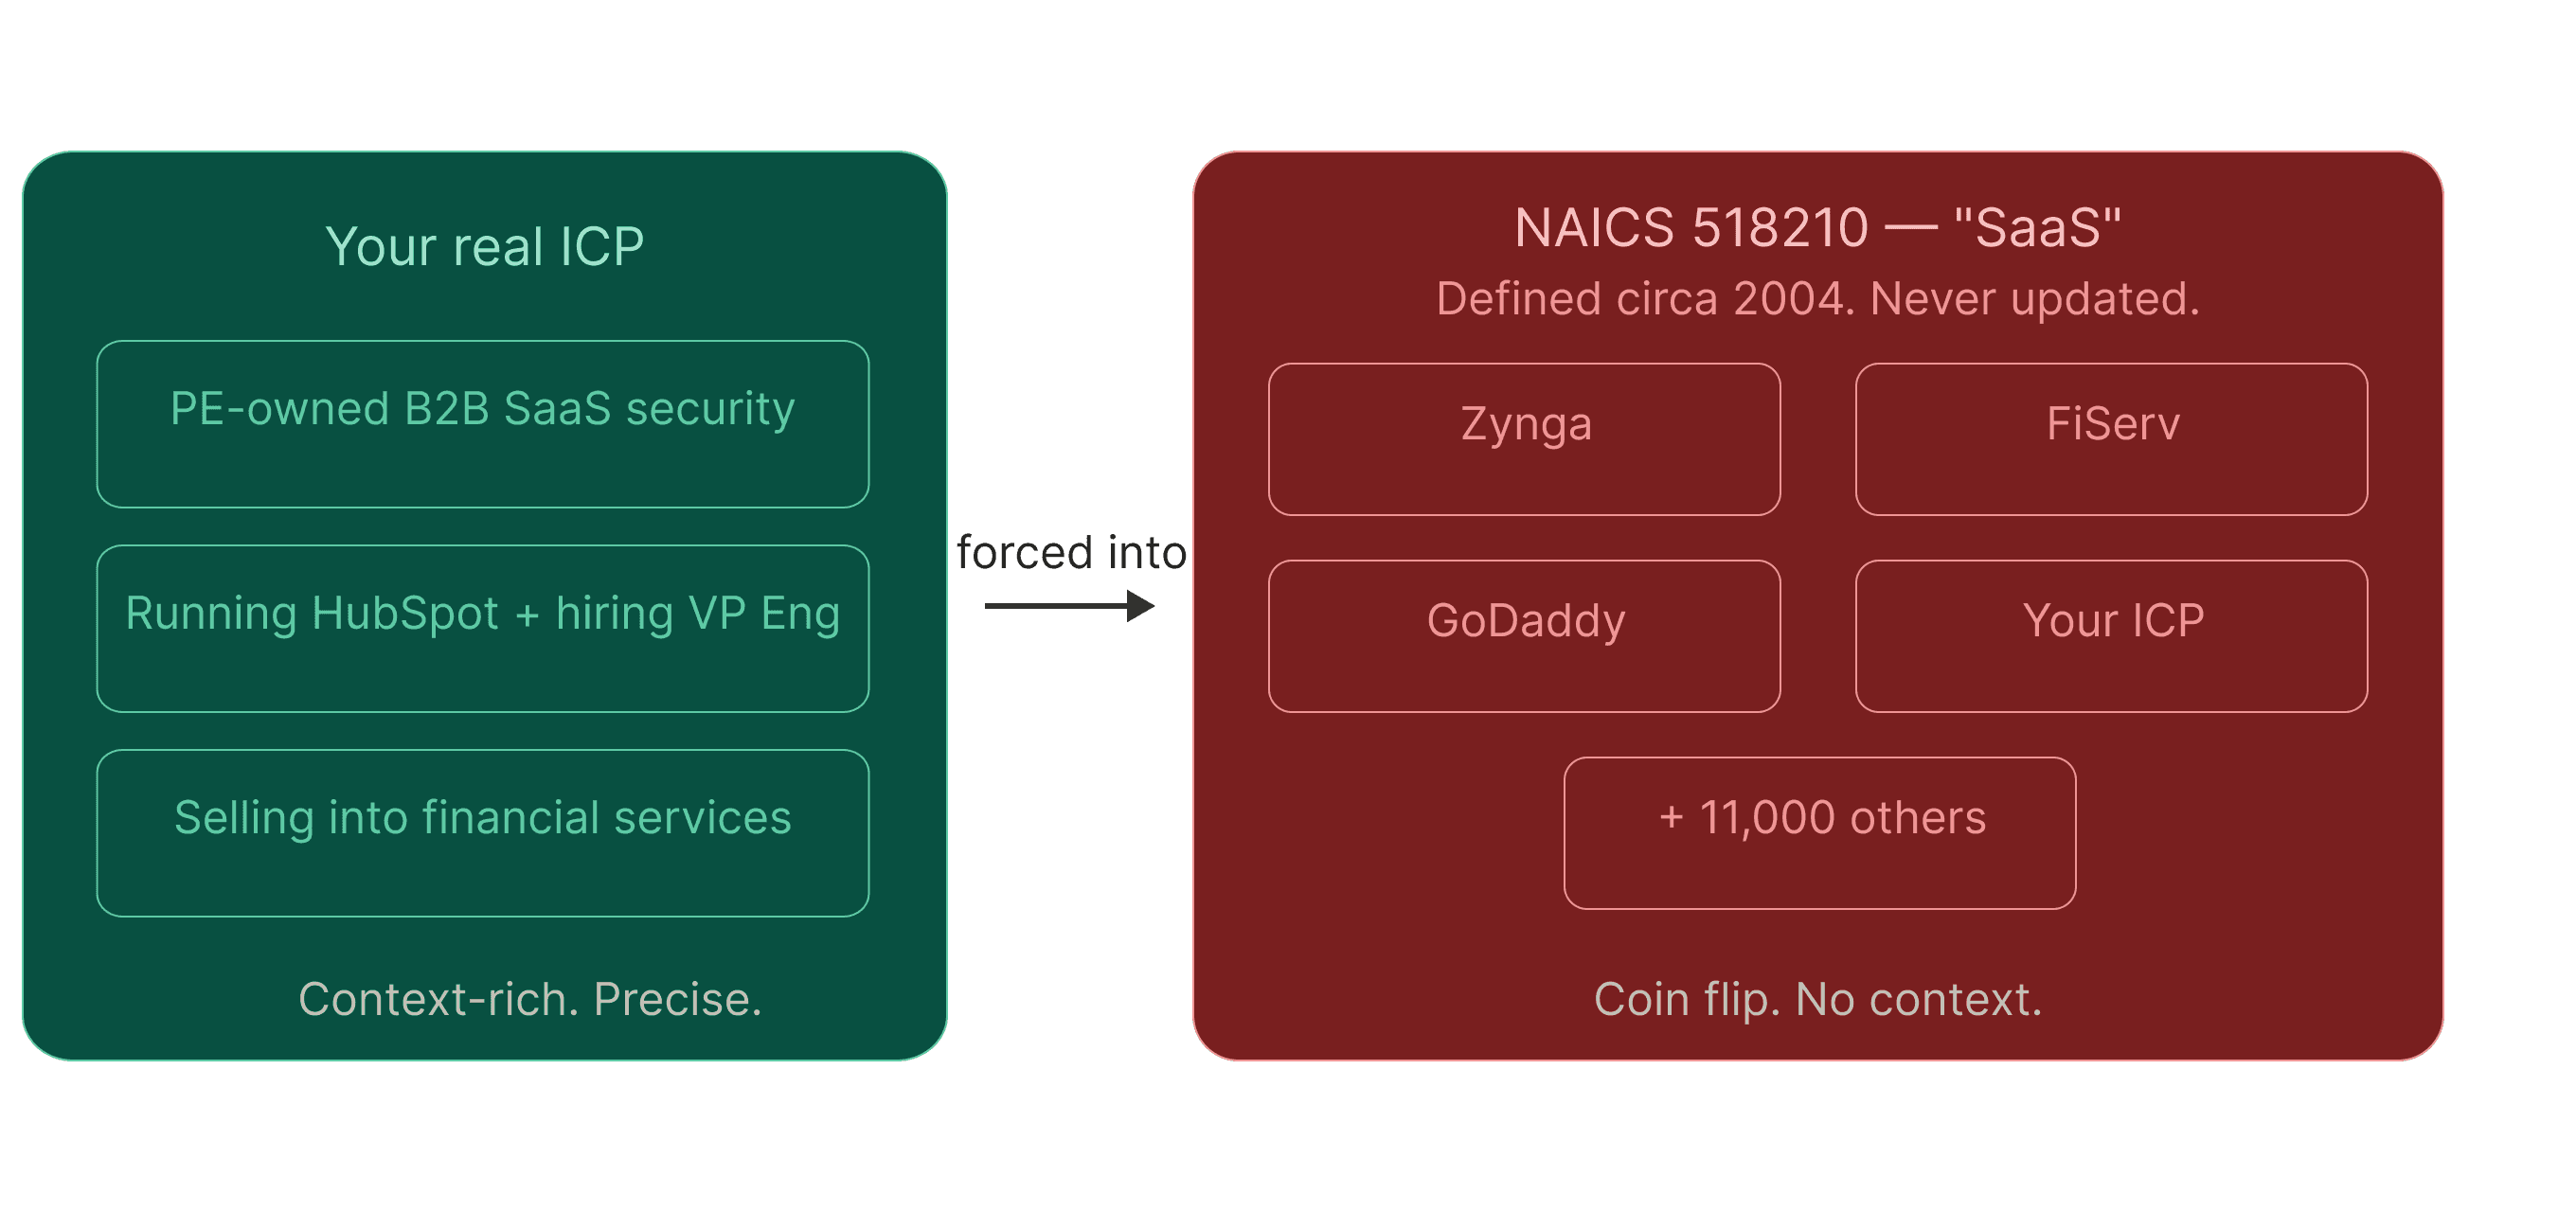
Here is what current providers hand your team: A list, keyed “SaaS companies” or “NAICS code 518210.”.
NAICS code 518210 is supposed to define SaaS but really doesn't. Because of this, companies as different as Zynga, FiServ, and GoDaddy are all thrown into the same bucket.
But the reality is that some nameless, faceless middle manager – let’s call him Larry – created that category decades ago in his beige cubicle after lunch. It has not been updated since. It tells you nothing about a company's actual mission.
That's the “NAICS Code Tax”, hereby defined as “the hidden, huge cost of letting other people define your ICP.”. You're paying for precision, but you’re getting a coin flip.
Your ICP isn't some random category code or keyword. It's: PE-owned B2B SaaS Security firm selling into financial services, running HubSpot, hiring for a VP of Engineering, and actively evaluating X alternatives.
See the difference? That's context. And you can't get context from a dropdown menu that Larry architected while Bill Clinton was still in office.
Volume Doesn't Win Anymore
Every vendor has millions of contacts. We've collectively solved the volume problem. Still, many vendors cling to “org count” or “number of people in their database” as if that still means something.
To be fair: at one point, maybe it did. But today? Contact count is a vanity metric that does not matter.
It’s 2026. Context matters much more than quantity. The best RevOps teams are no longer “spraying and praying.” They are hyper focused.
Let’s pretend, for a moment, that your GTM data sources deliver all the contacts and emails you want. This is helpful, but it still doesn't solve the 2026 problem. The 2026 problem is contextual relevance.
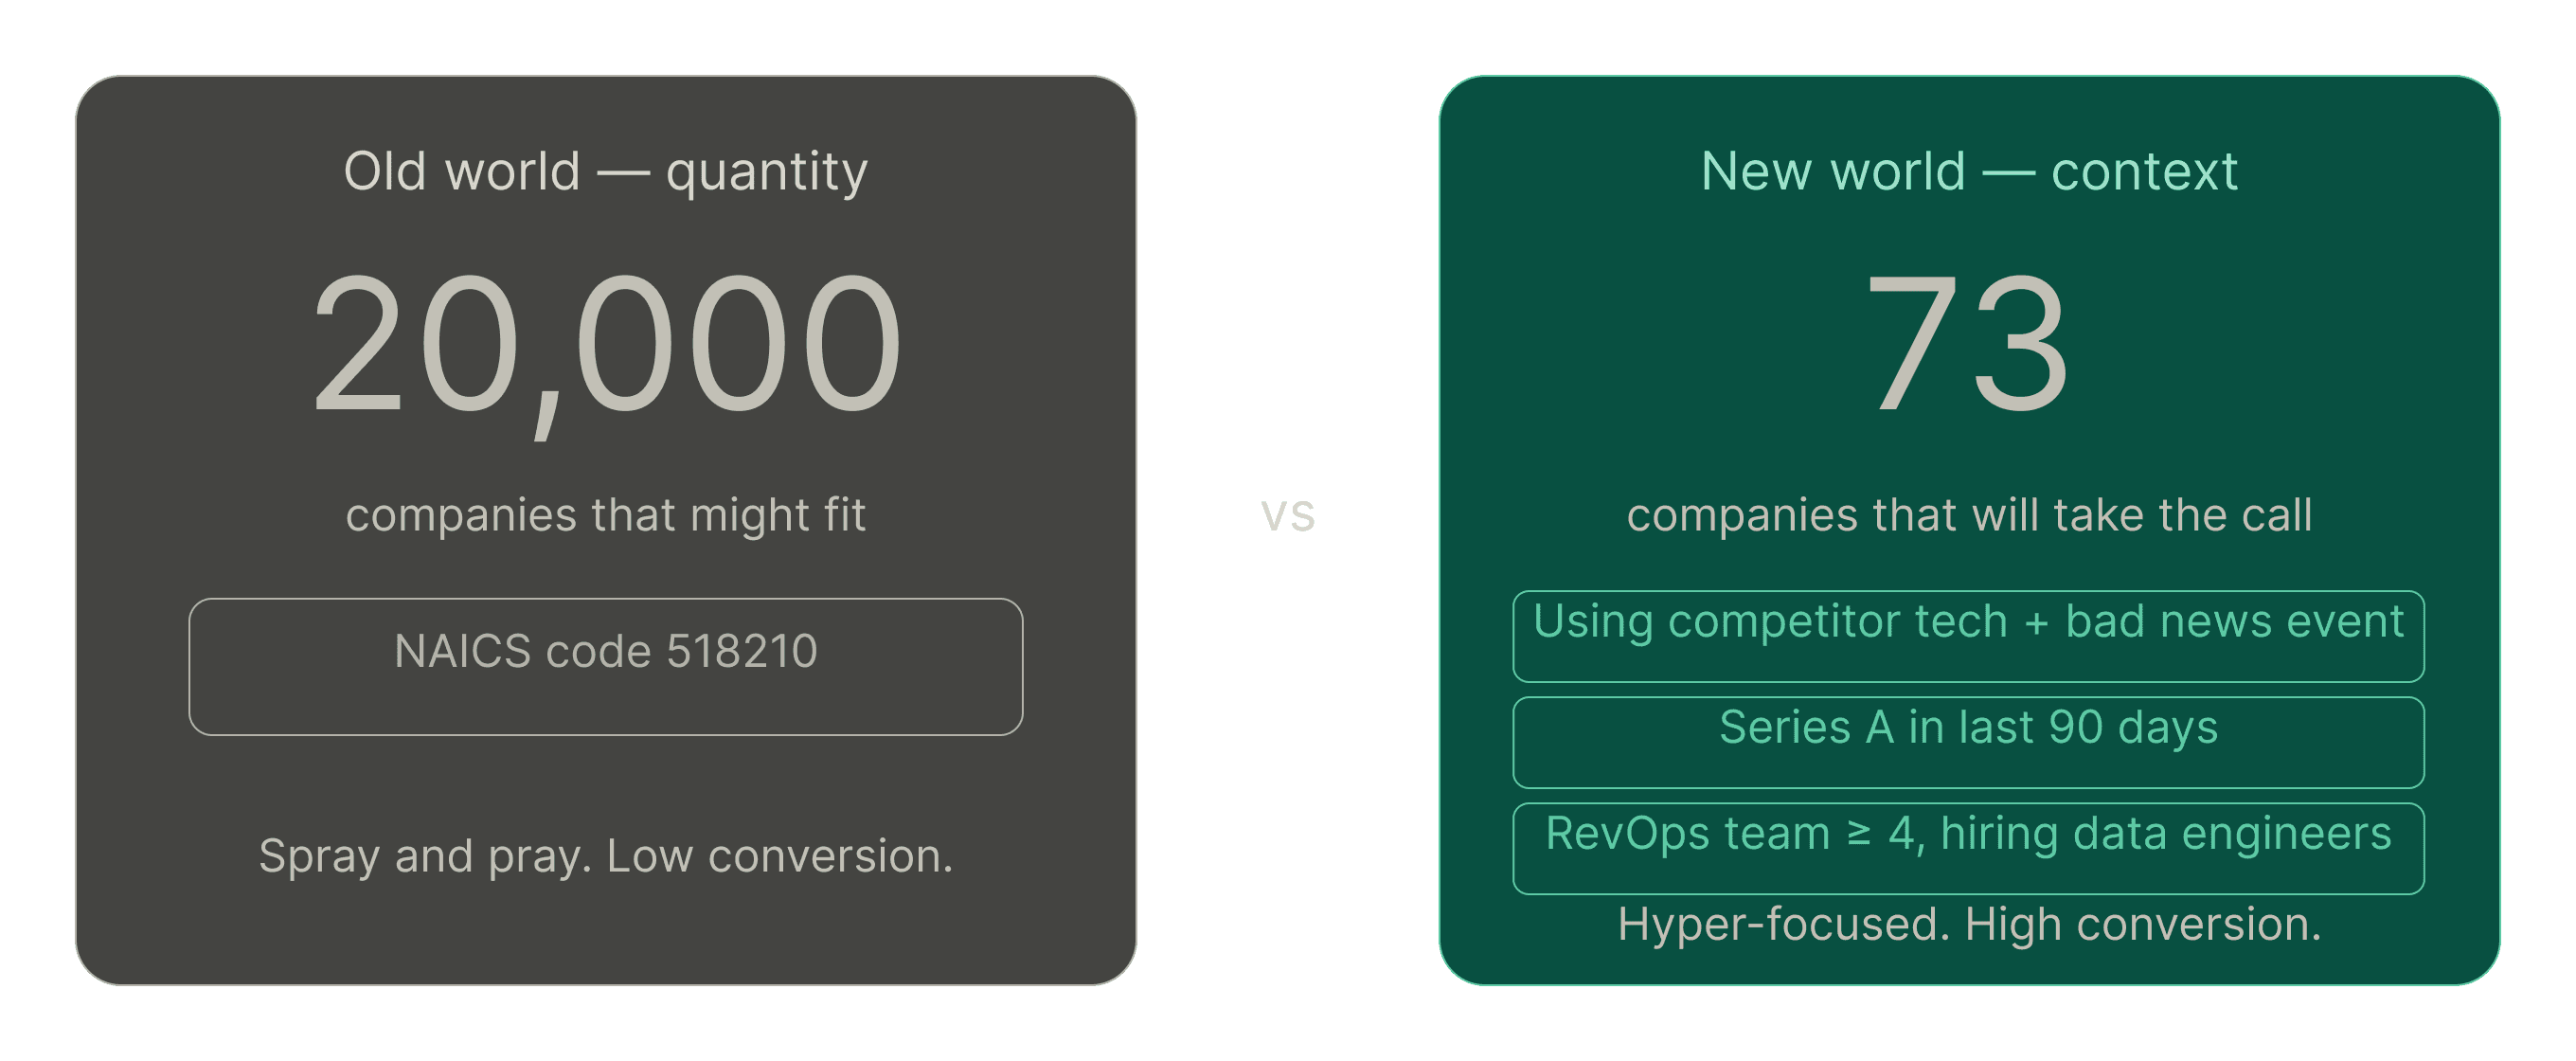
Your SDRs don't need 20,000 companies that might fit your profile. They need the 73 companies using tech built by a competitor that has just had a bad news event, has received Series A funding within the past 3 months and has a Revops team of at least 4 people, which is actively hiring Data engineers, and that shows a new partnership or M&A activity in the past 120 days .
That's the shift: context over quantity. Here's why most platforms can't deliver it.
2D Data Is Just Excel With A Better UI
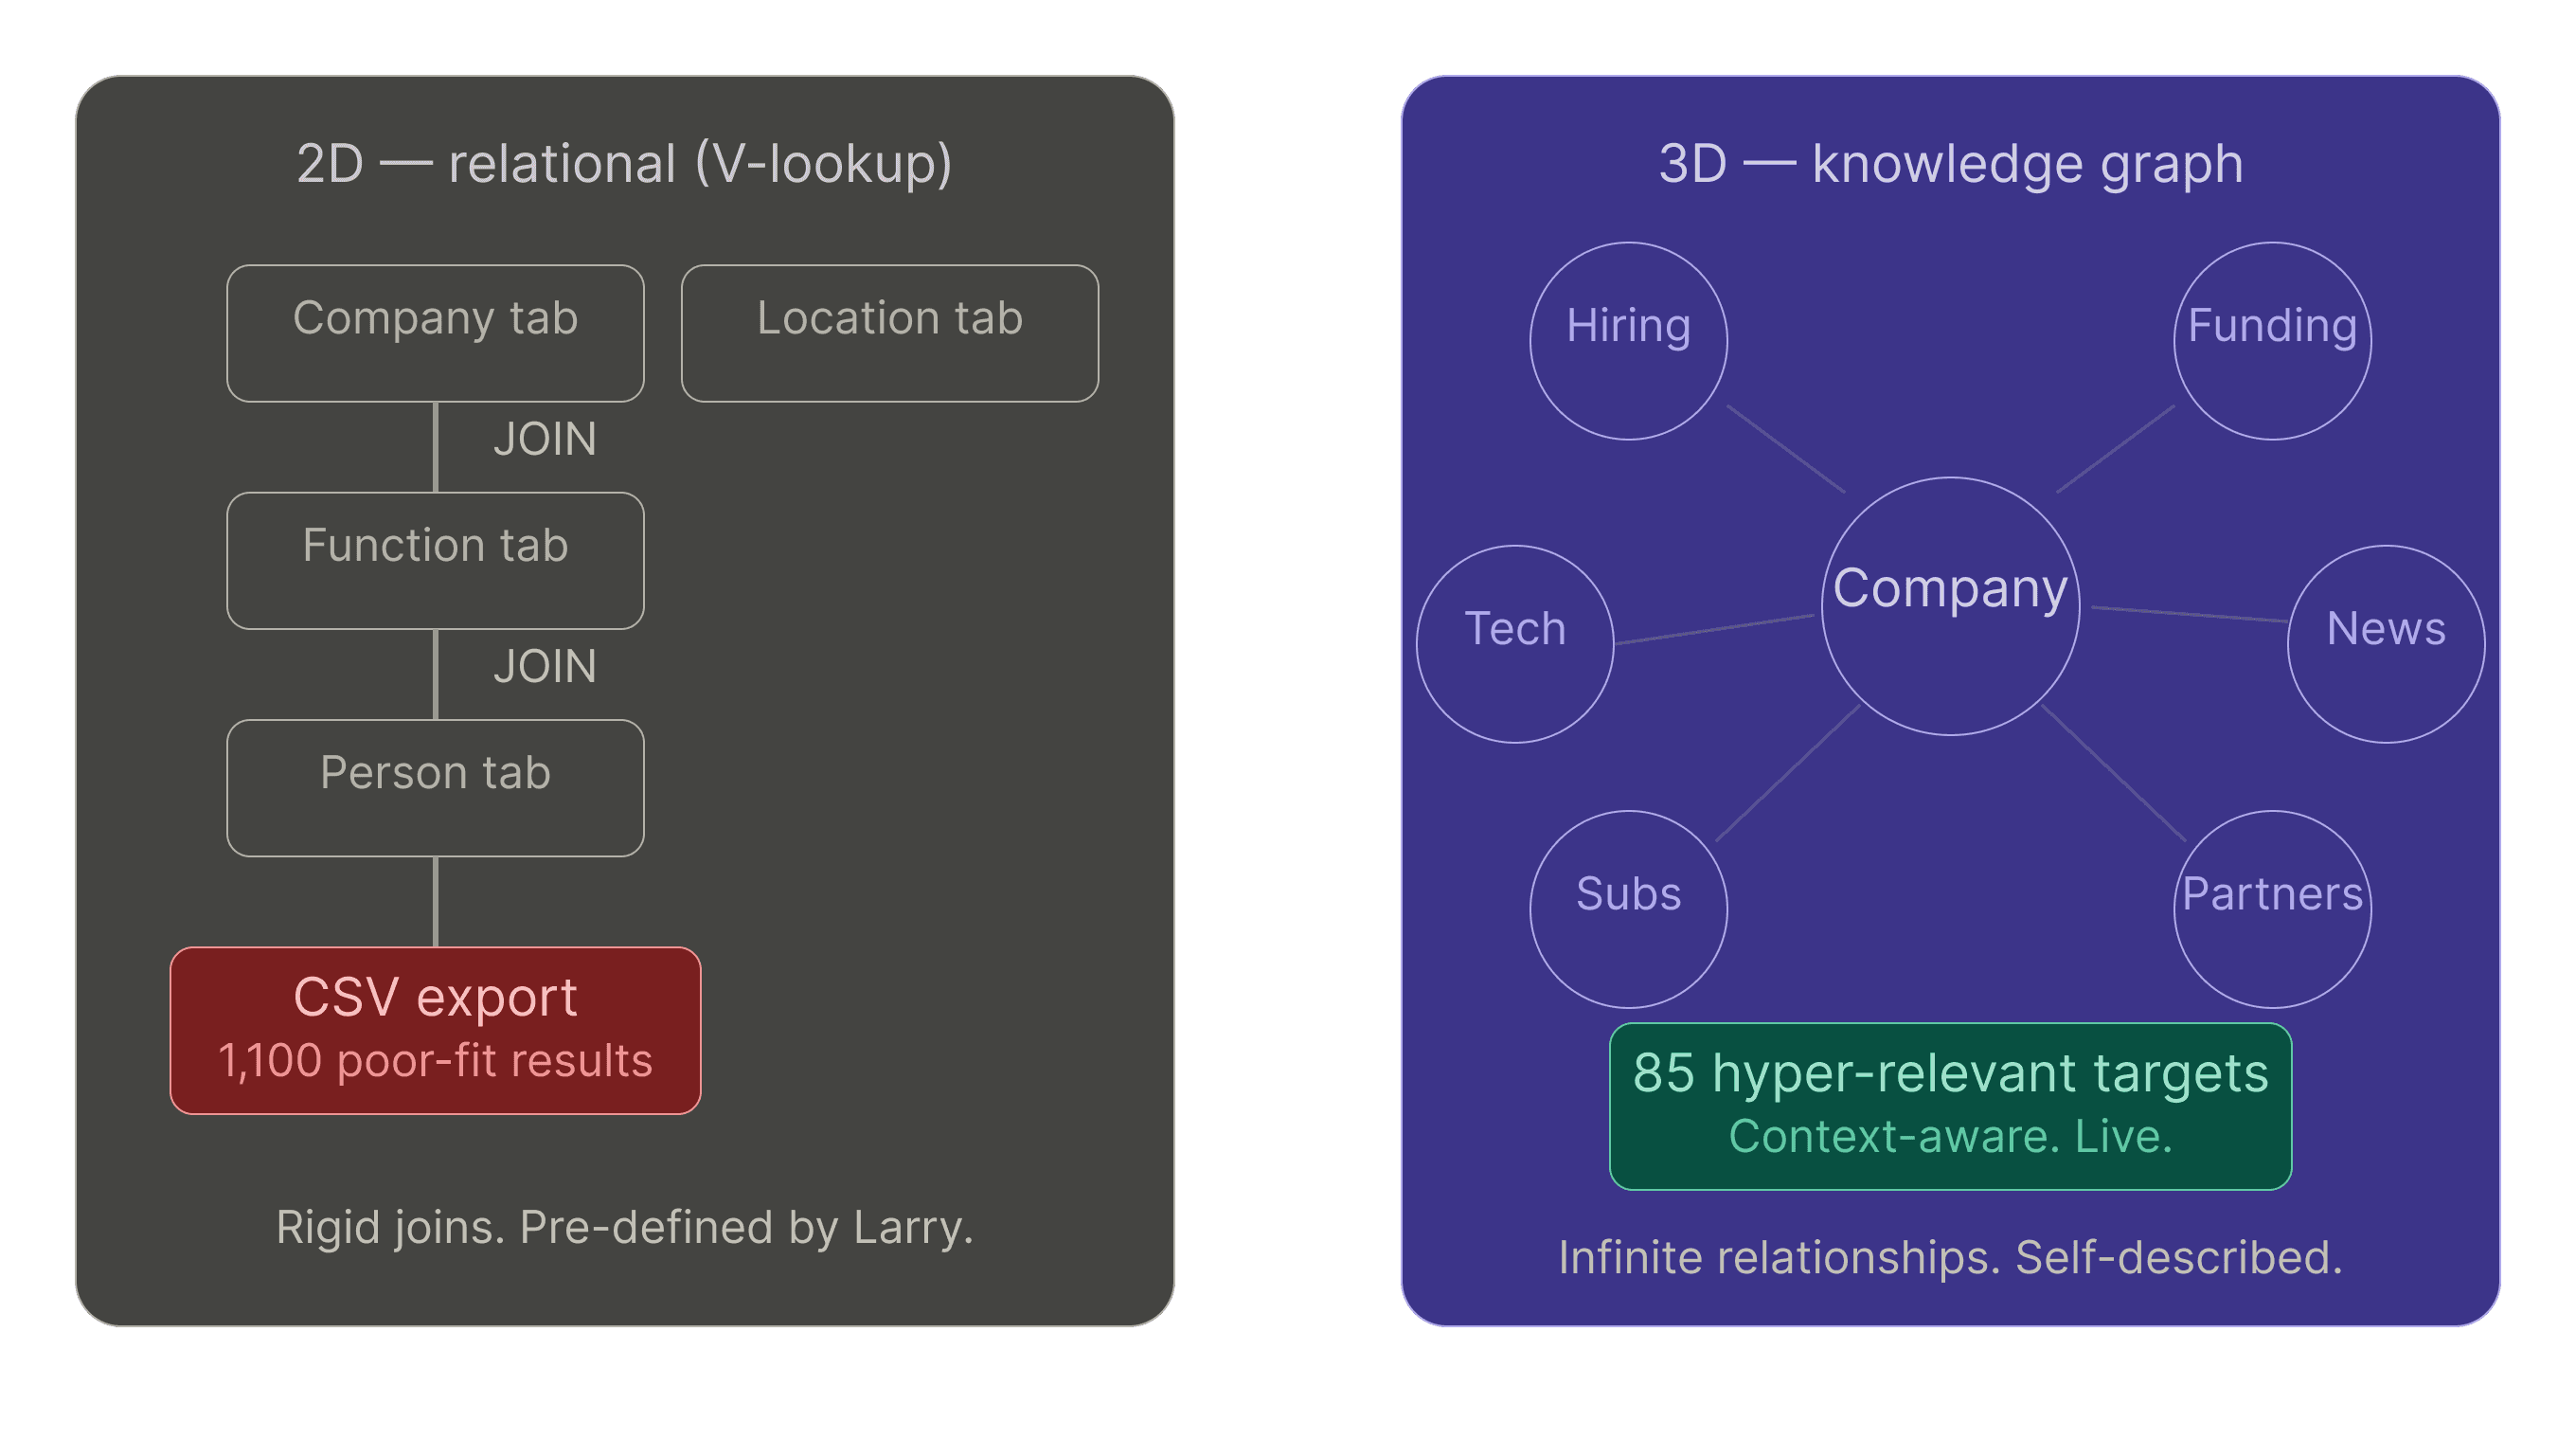
Traditional data platforms use relational databases. Think: tabs in a spreadsheet and a lot of V-lookup commands to connect those rigid data sets into usable, if brittle, GTM outputs.
Company tab. Location tab. Function tab. Person tab. You get the idea.
To find someone, you “just” do this:
Join company to location
Join location to function
Join function to person
Roll all the way back up to start over for the next person
It's the V-lookup problem at enterprise scale.
Worse: those joins are pre-defined by either Larry or legacy providers who decided in 2014 what "manufacturing" should mean to you in 2026. You get to pick from their 27 industry definitions.
The real issue is that these joins are predefined. Someone else decides what "manufacturing" means, and you are forced to pick from their limited definitions.
So you really are not filtering your ICP. You're filtering an approximation of your ICP, defined by either Larry in his pleated khakis and beige cubicle in 1996, or your data provider, which is really just a glorified V-Lookup company masquerading as a “SaaS data provider.”
It doesn’t have to be this way. You deserve so much more. So does your RevOps squad.
Self-Described Beats Pre-Defined
Legacy platforms that categorize accounts based on NAICS codes and other preset industry definitions force your ICP into pre-made definitions. By doing this, they make you compromise on what you really want.
Our solution is to leave the data messy on purpose. Instead of forcing a company into a pre-set industry code, we use NLP at scale to listen to how companies describe themselves. We extract how companies describe themselves—from job postings, news releases, websites, partnerships, and more. With our platform, you define your ICP companies by what they actually do, instead of guessing which pre-defined industry they might fit into.
This lets you categorize the market exactly how you want. You define the industry based on what a company actually does today, not how Larry (and his combover) defined them years ago.
That means instead of "manufacturing," you get:
Cylindrical ceramic ball bearing manufacturers that serve the high-torque aerospace engine market
Land-surveying drone companies that monitor for invasive plants and early signs of drought, powered by the Vast Sky operating system and headquartered in the DFW area
Makers of specialty carbon-fiber aircraft components that are headquartered in France and do not have a manufacturing presence in the United States.
Now you're targeting companies that actually do what you care about. Not companies that got filed under the same antiquated taxonomy. And yes, GraphIQ has supported these exact data needs for our customers.
And when you layer technologies on top—"companies using Jira + Atlassian + GitHub, with 75+ developers"—you're building lists that actually convert.
What 3D Data Actually Means: The Diamond Funnel
You might have heard of a bowtie funnel. We propose an alternative: the diamond funnel. You can explore and target your ICP using a diamond shape. In fact, you should be.
Our knowledge graph doesn't force data into rigid, pre-defined tables. It collects data from the public web every second of every day. It resolves this data (ensuring, for example, that an article about “Apple” is attached to the computer company and not the Beatles’ record company from 1968). It leaves the data messy—on purpose—and then applies limitless relationships from the outside.
We call these relationships "ontologies." They're multi-dimensional connections that let you push, pull, and define from any direction.
Example: You want companies similar to a customer you just closed so that your SDR team can get after it.
2D approach: Match their industry code, revenue band, and employee count. Get 1,100 results. Download into a spreadsheet. Manually sort. Try to divvy them up among your SDR team as fairly as you can.
3D approach: Start with their unique capabilities. Expand to 73,000 similar organizations using lookalike capabilities drawn from the way companies describe themselves online. Then iteratively narrow this list, using technologies + partnerships + news + hiring patterns. Distill this list down to 85 hyper-relevant targets.
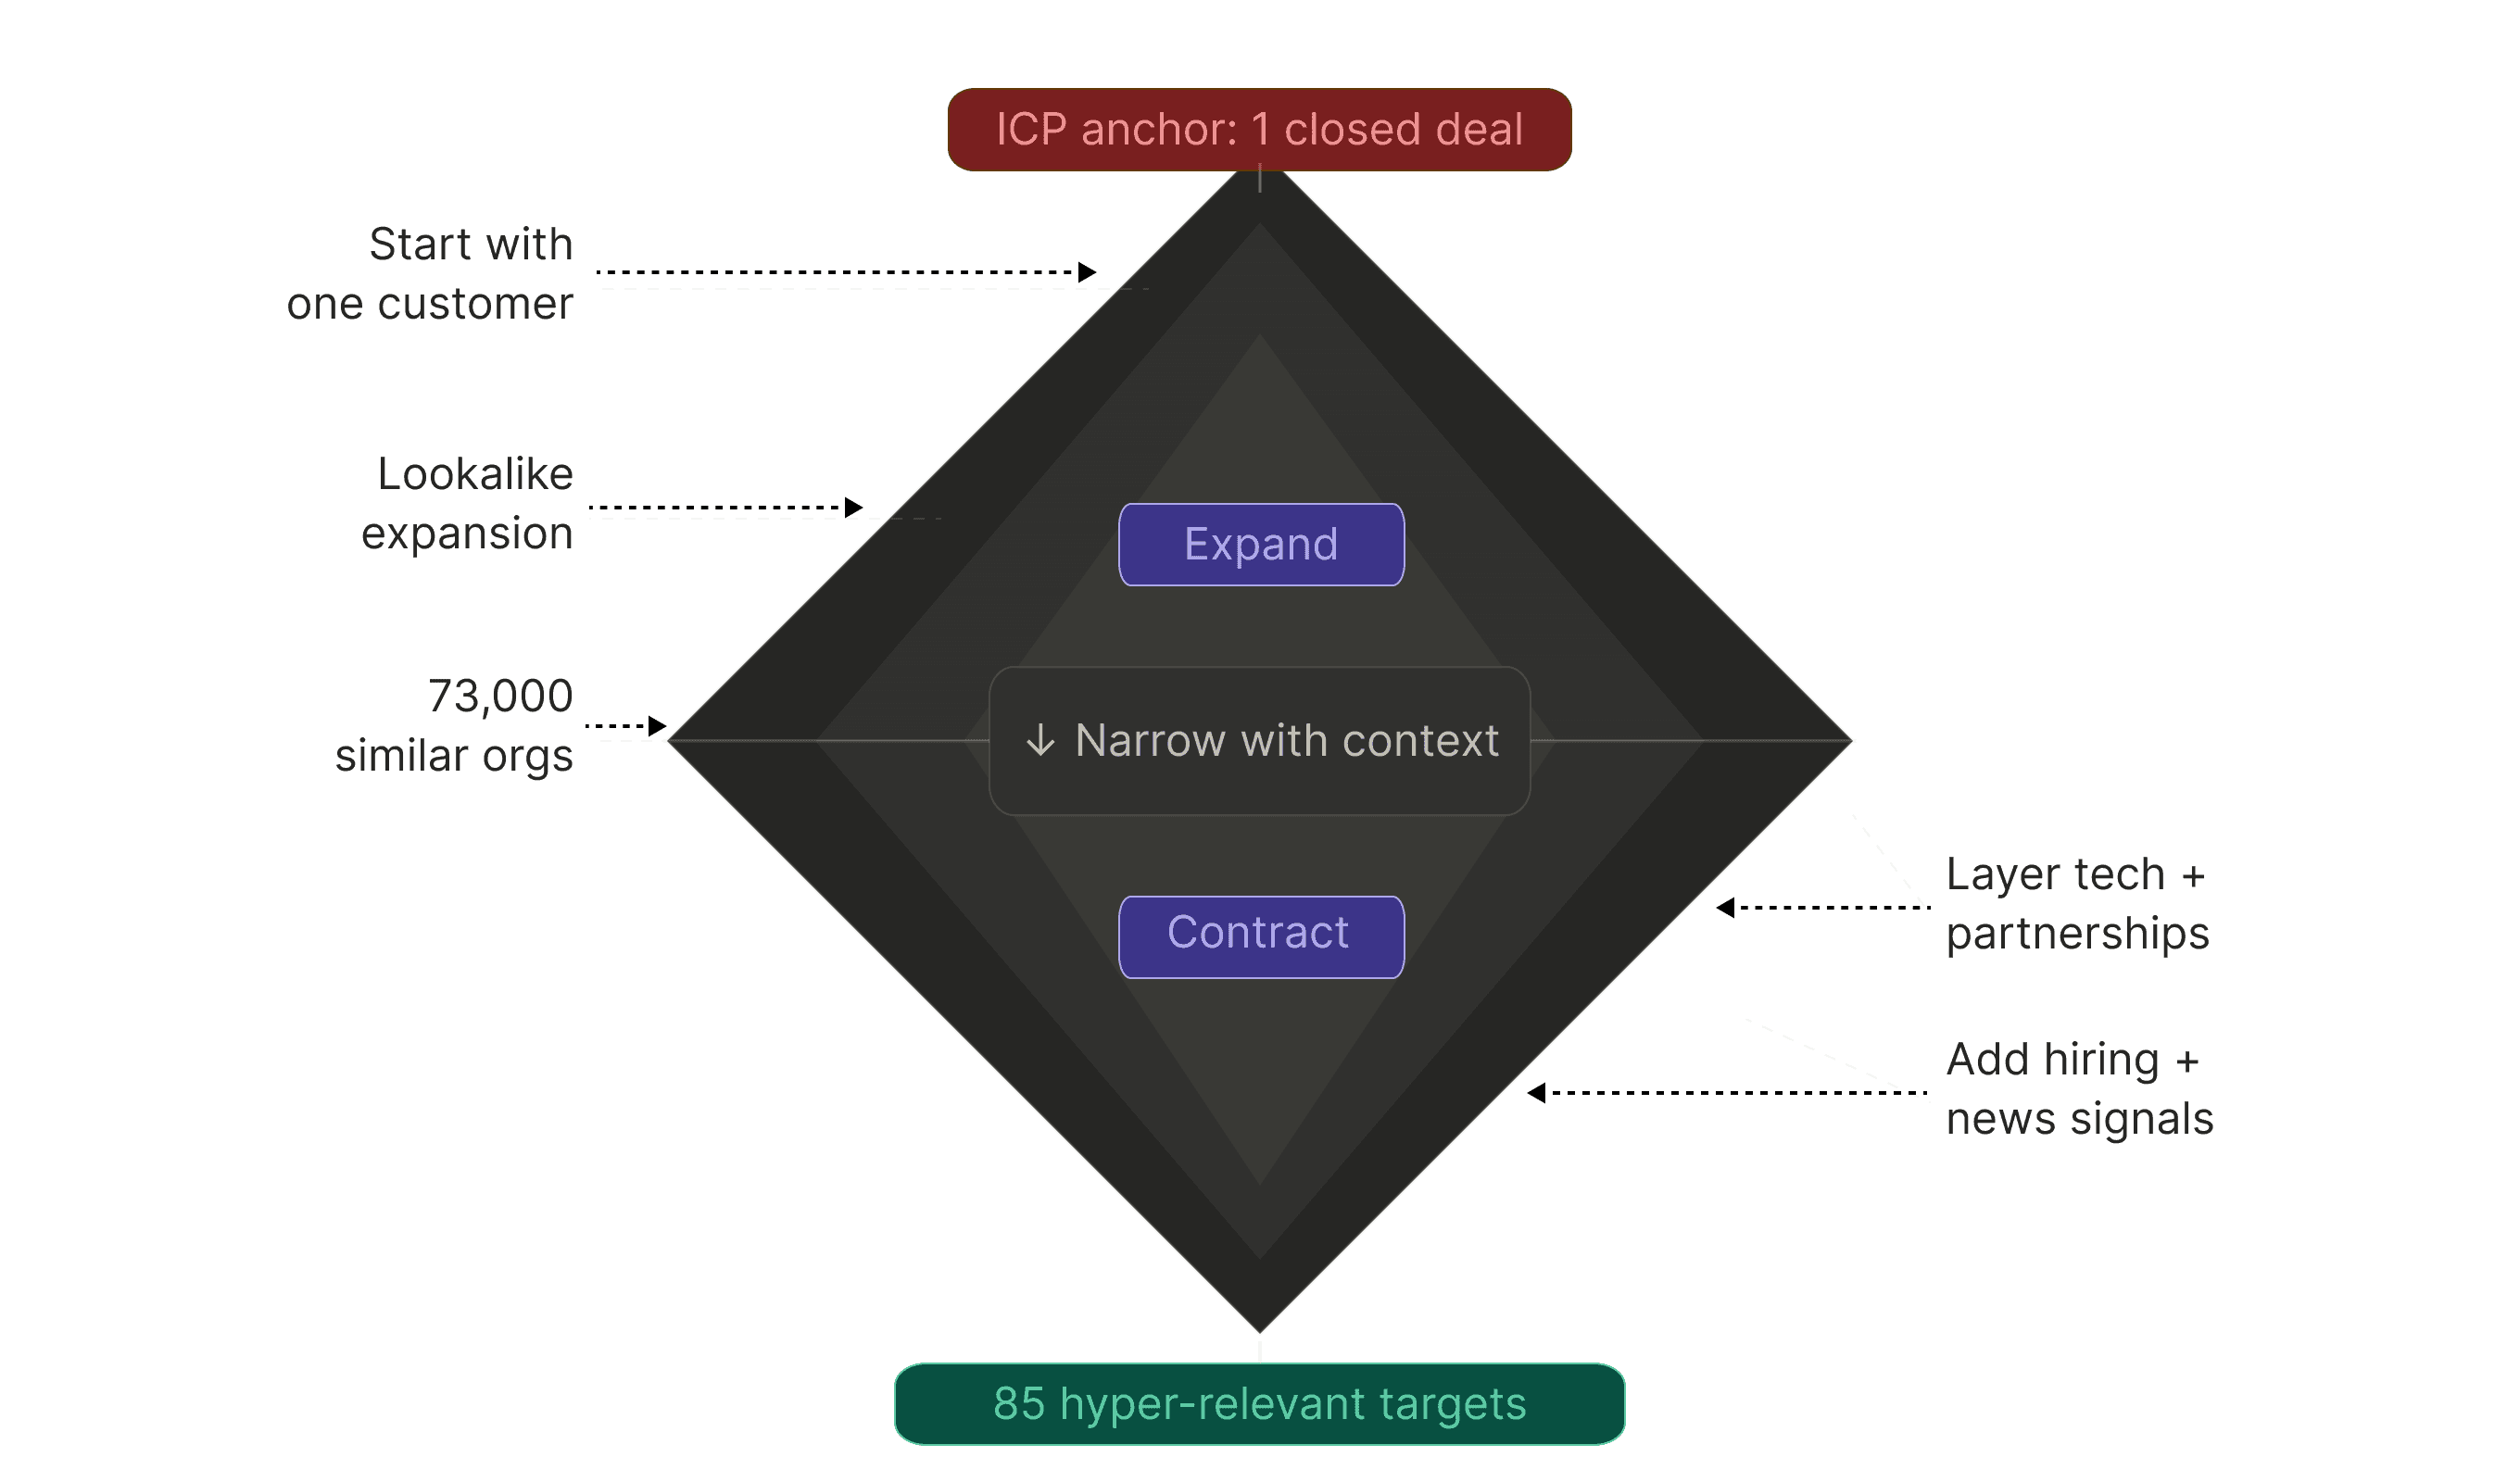
That's the diamond funnel. Expand wide, then contract tight.
You can't do that with static filters. You need a system that guides you to iterate through context. You need a system that encourages and rewards your bowtie process, supporting your growth with purpose and scale.
Why This Matters for Agentic Workflows
If you're building AI agents for prospecting, you've noticed that those static filters limit your agents’ ability to make a real impact.
You need an agent which can:
Pull similar orgs based on capabilities and technologies
Find their subsidiaries and parent companies
Identify key stakeholders across the corporate hierarchy
Layer in recent news signals (funding, M&A, partnerships)
Prioritize by multi-dimensional relevance
Distribute them to your SDR team using territory rules, a rules-based round-robin engine that ensures that everyone gets their fair share of hot leads, or anything else that fits your business.
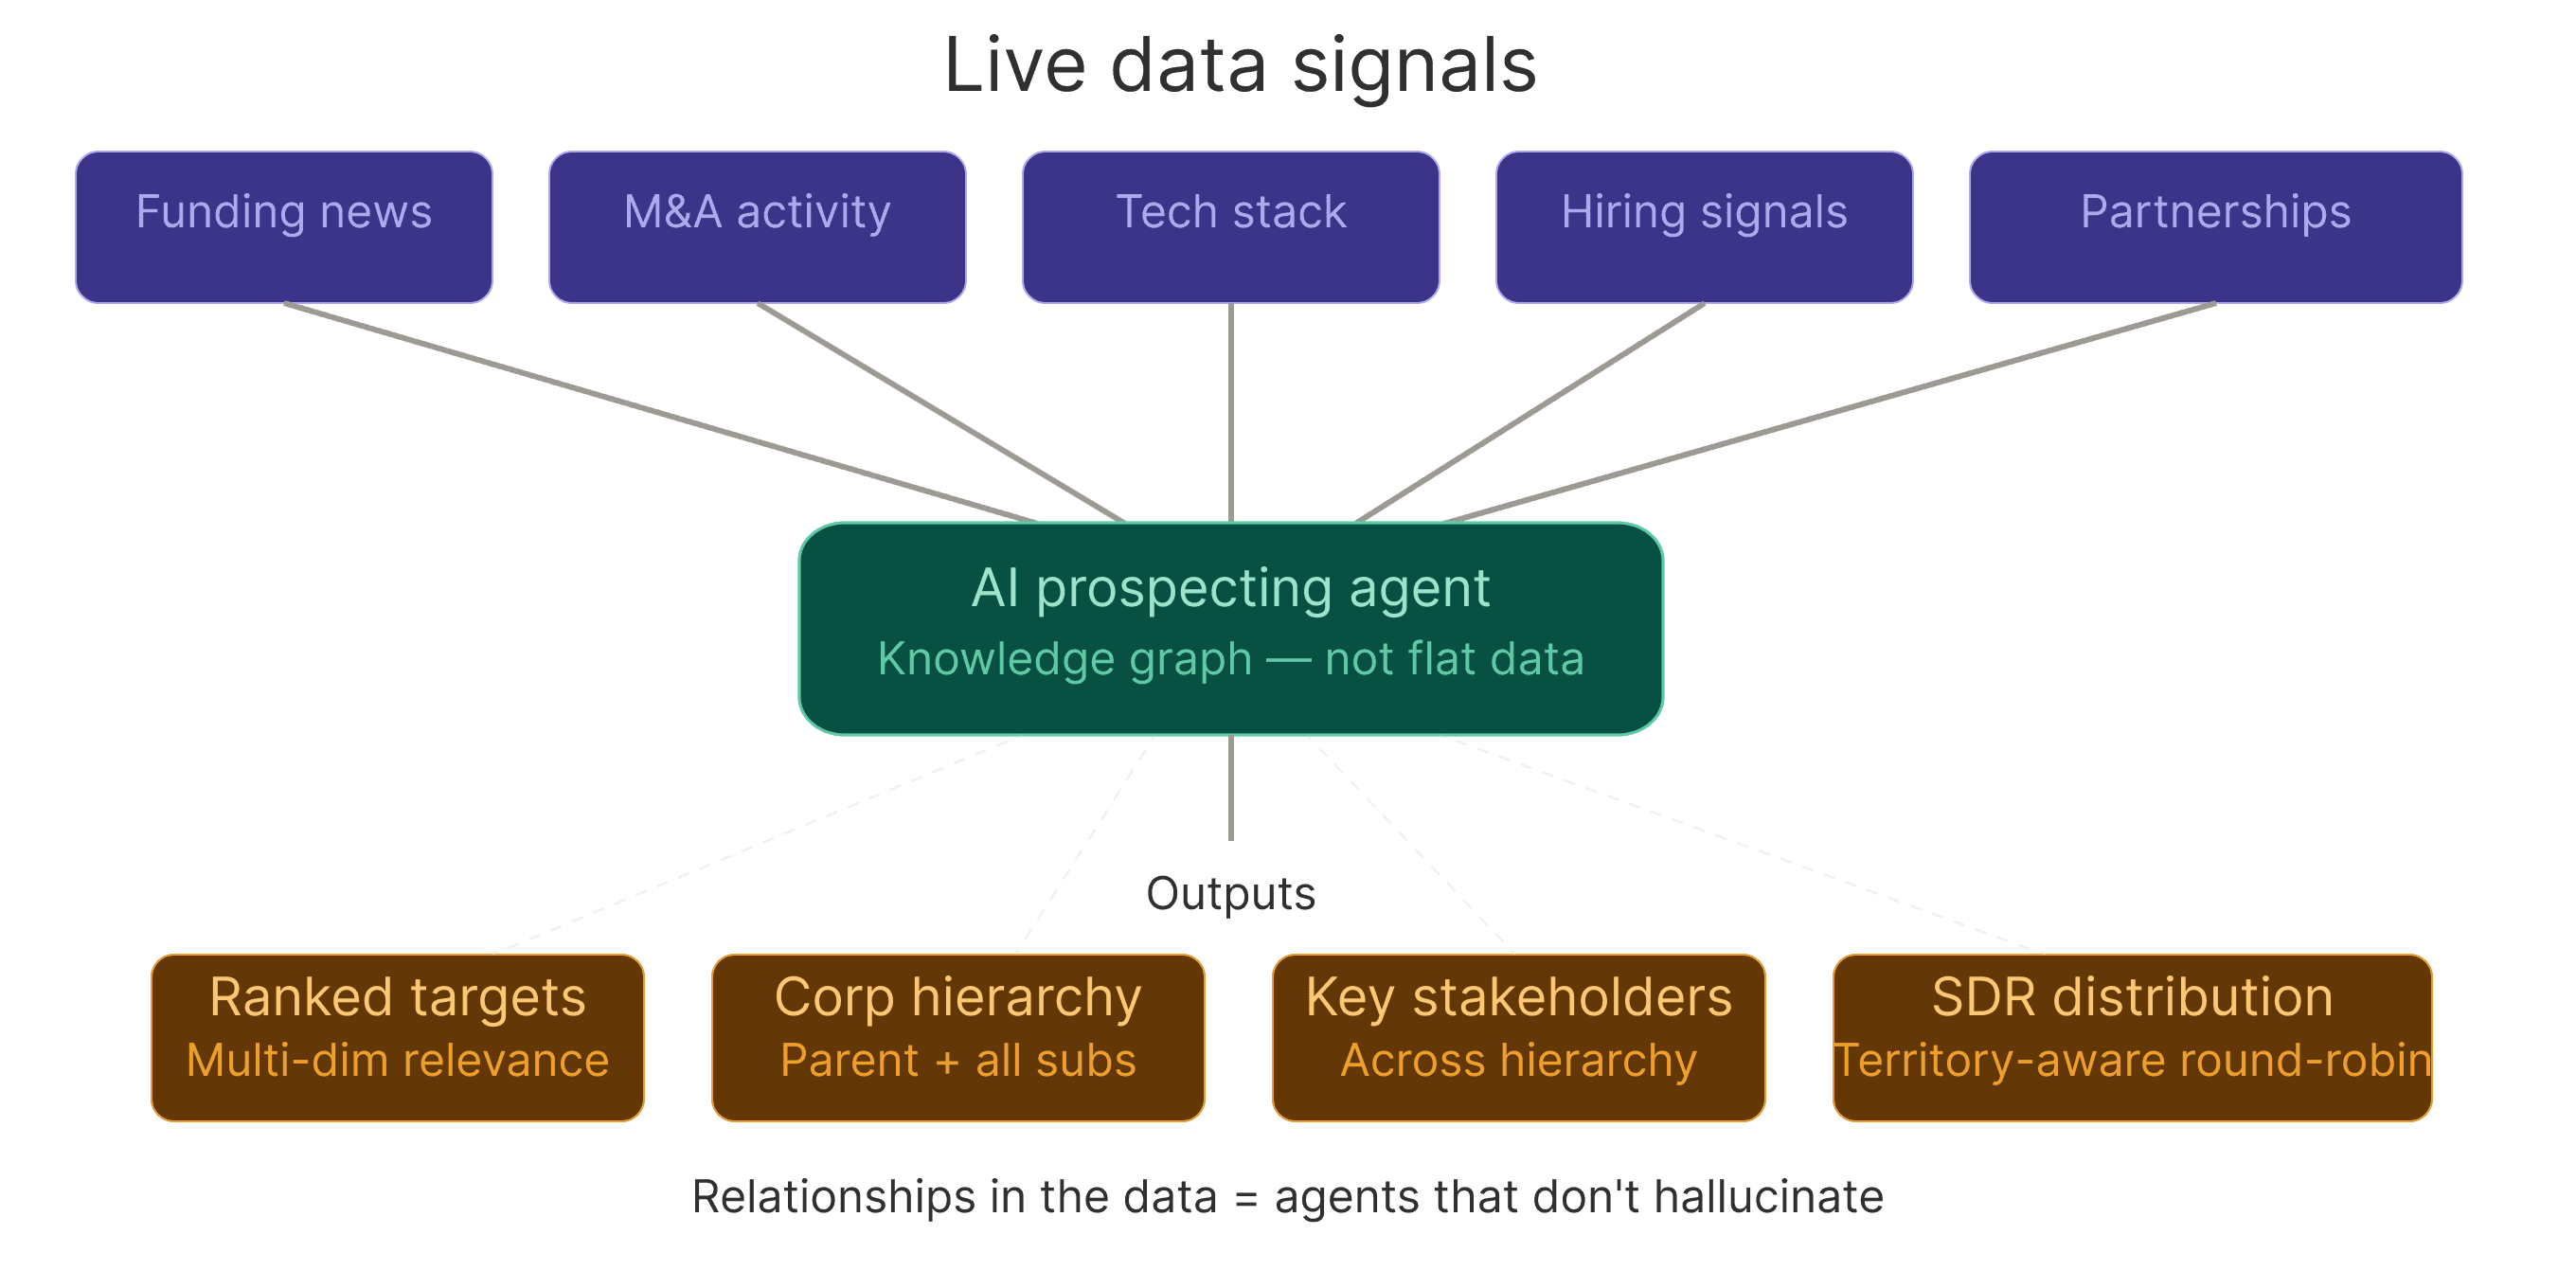
That workflow requires data with relationships, not just records joined by V-lookups. If the data does not have relationships, even the best agent will confidently hallucinate.
This is why legacy platforms keep bolting on "AI features" or “AI SDR coaches” that don't actually work and which fundamentally distract from their core mission. The data structure underneath can't support iterative, context-aware queries. They are desperate to hand-wave this fact away with “smart AI” bolt-on agents and technical gymnastics.
Fundamentally, they are pretending that a spreadsheet can think like a neural network. It can't. And it never will be able to.
The Parent/Child Problem Nobody's Solving
Here's a use case that breaks most platforms (and which GraphIQ has already solved):
Your best rep just closed Lucasfilm. Congrats!. Now you want your SDR team to target Hulu, ESPN, ABC, Marvel, and Disney’s other 153 subsidiaries.
With 2D data, those are separate records. Maybe they're linked. Probably not. If they are, your RevOps team has manually built and corrected that list, then used what they hope is accurate data for account, territory planning, and nurture campaigns.
With 3D data, the relationships are native. One click shows you the entire corporate family. Another click shows you the exact people within these 153 orgs who are likely to care about your offering, along with fresh contact information, their LinkedIn profile, and a summary of what they have done in their career.
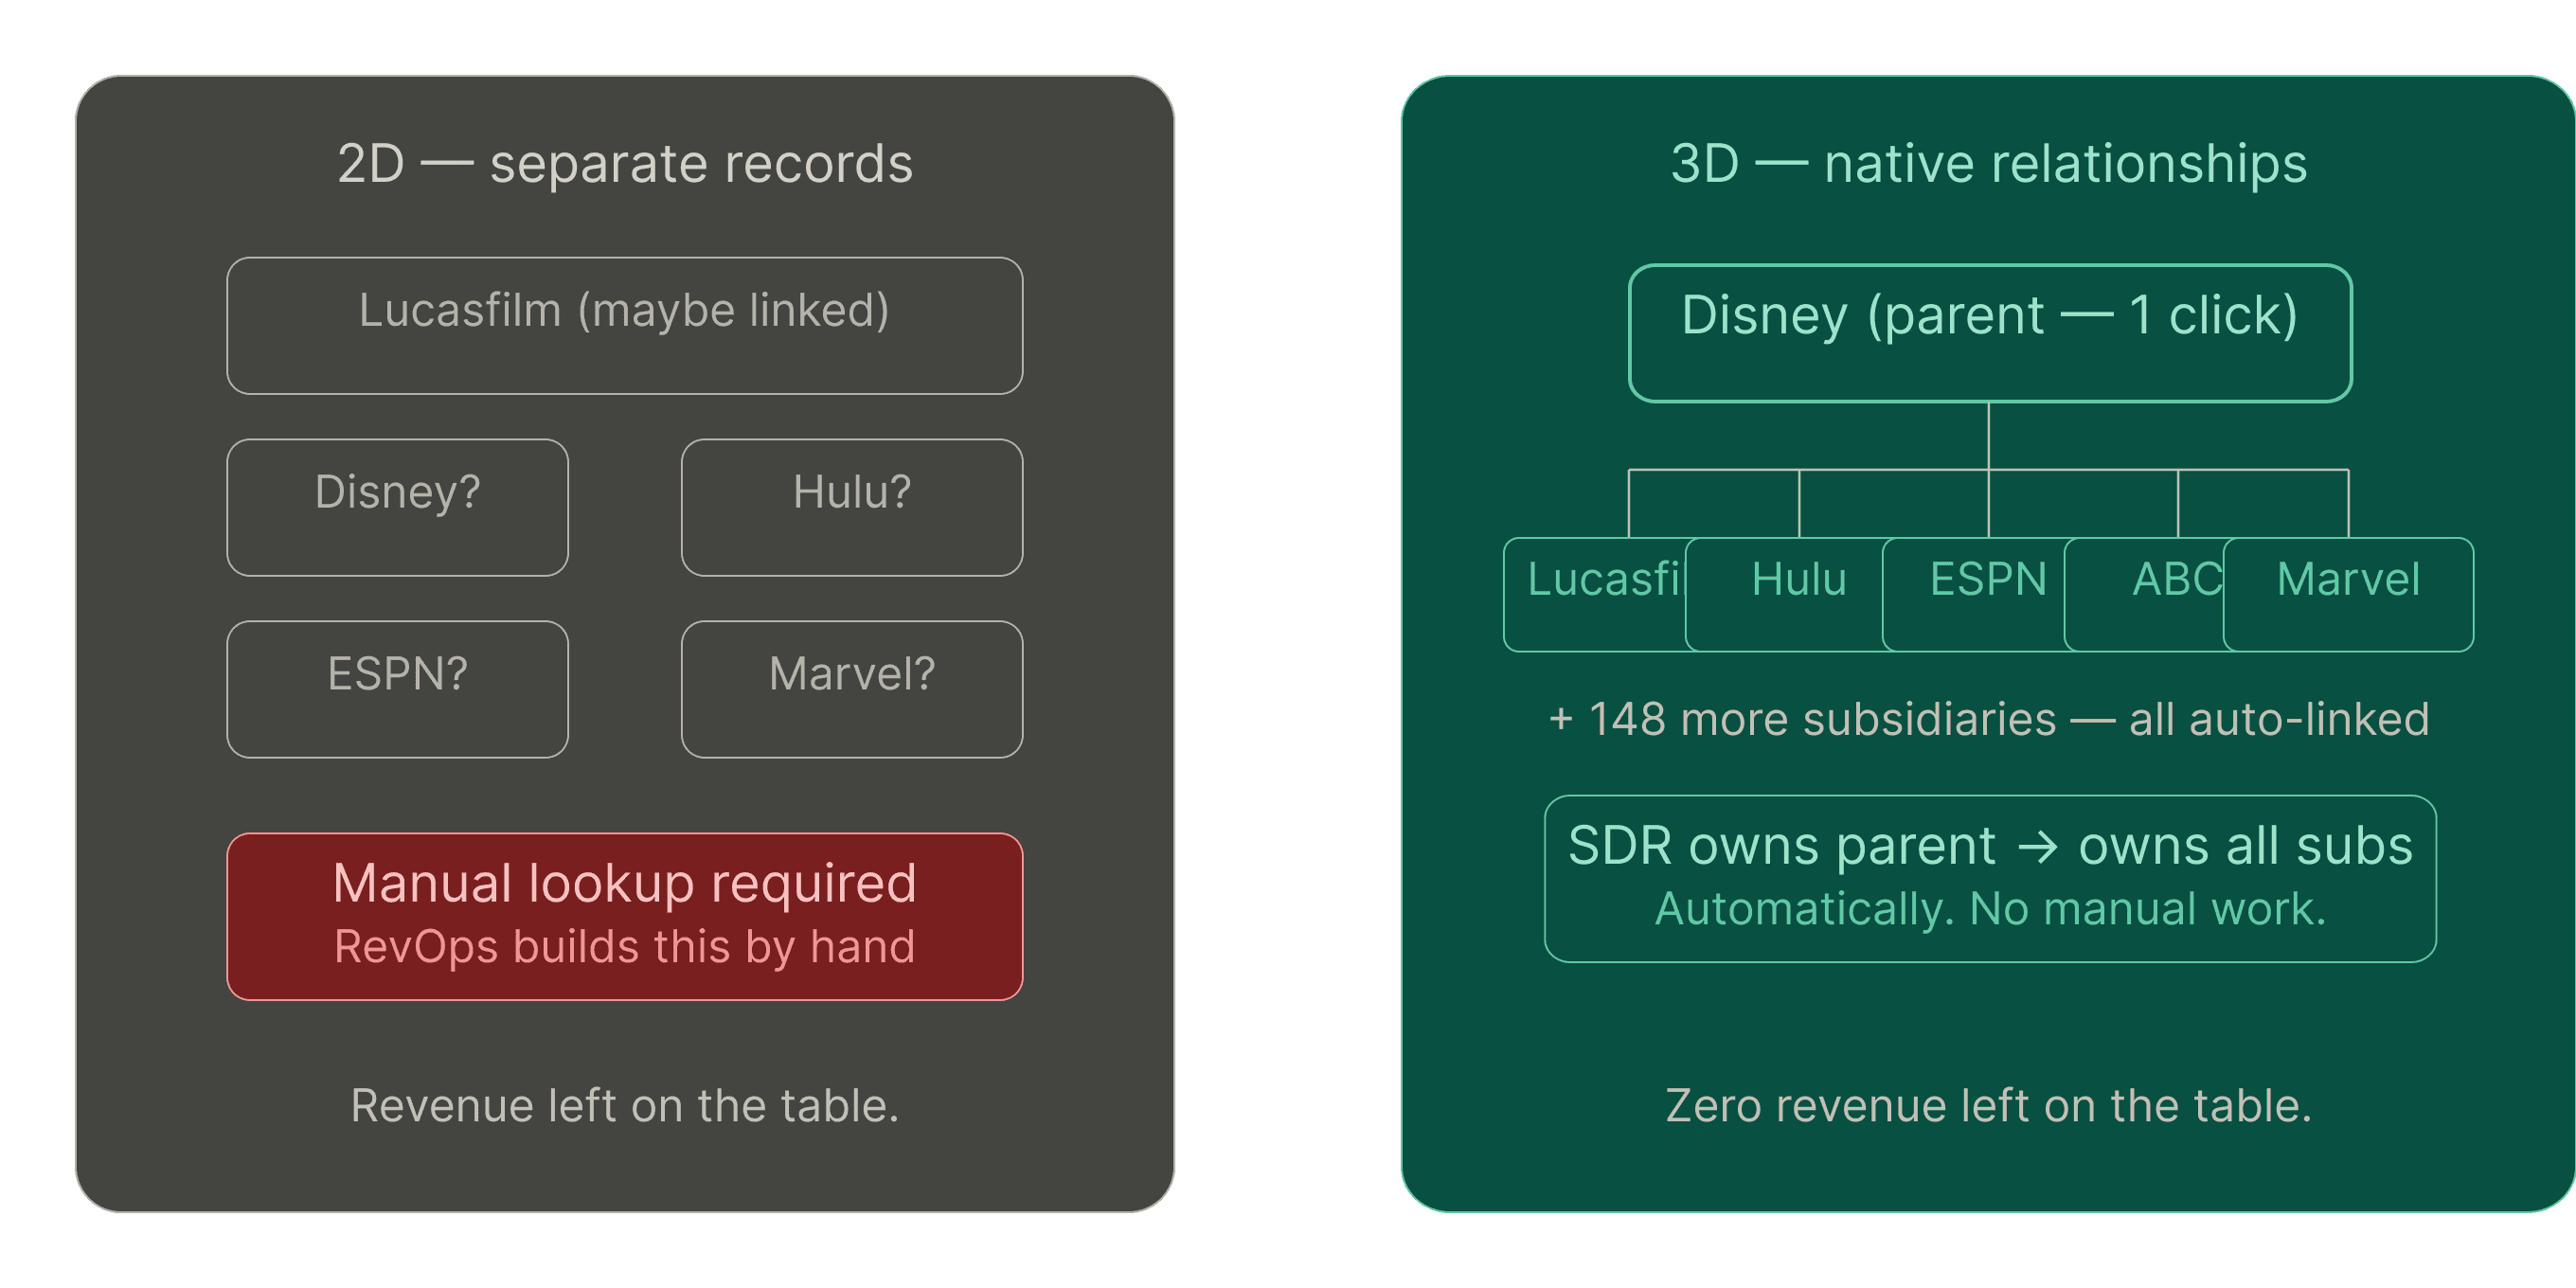
Your SDR owns the parent? Then s/he should own every sub. Automatically.
That's not a "nice to have" feature. That's revenue you're no longer leaving on the table. That’s accurate account scoring for your CRO. That’s getting ahead of fistfights and friction between your Sales, RevOps, and Marketing teams and helping align GTM strategy to on-the-ground reality.
What This Looks Like in Practice
One of our RevOps agency partners ran a test.
They pulled 100 accounts from their client's CRM. Secured employee counts from D&B data. Dumped all of that into a CSV. Then ran the same list through our knowledge graph, asking us to enrich it with subsidiaries, locations, and the companies’ top 5 capabilities.
The result: 15 accounts moved to different tiers because the employee counts were off by 40-60%. The 100 account list grew into 117 accounts because they hadn’t known about 17 subsidiaries.
But here's what mattered more: they could filter by developer headcount instead of total headcount. Because their client sells to developers.
That's context. And it changed their entire territory design.
They didn't need more data. They needed the right dimensions. So does your RevOps team.
The Real Cost of 2D Thinking
Your RevOps team is sharp. They know how to work around sloppy data. They have been doing just that, thanklessly and in the shadows, for years.
But here's what you're paying for that workaround:
Frustrated SDRs burning time and calories on wrong numbers and outdated emails
Manual list building that takes days instead of hours
Territories based on rough proxies instead of real ICP signals
Agents that can't leverage your data because it's too rigid
Confidently incorrect hallucinations from said agents that frustrate everyone and dilute your brand
Inaccurate account scoring and revenue attribution, and conflict among your Sales teams, because you don't know the corporate hierarchy of the companies in your CRM
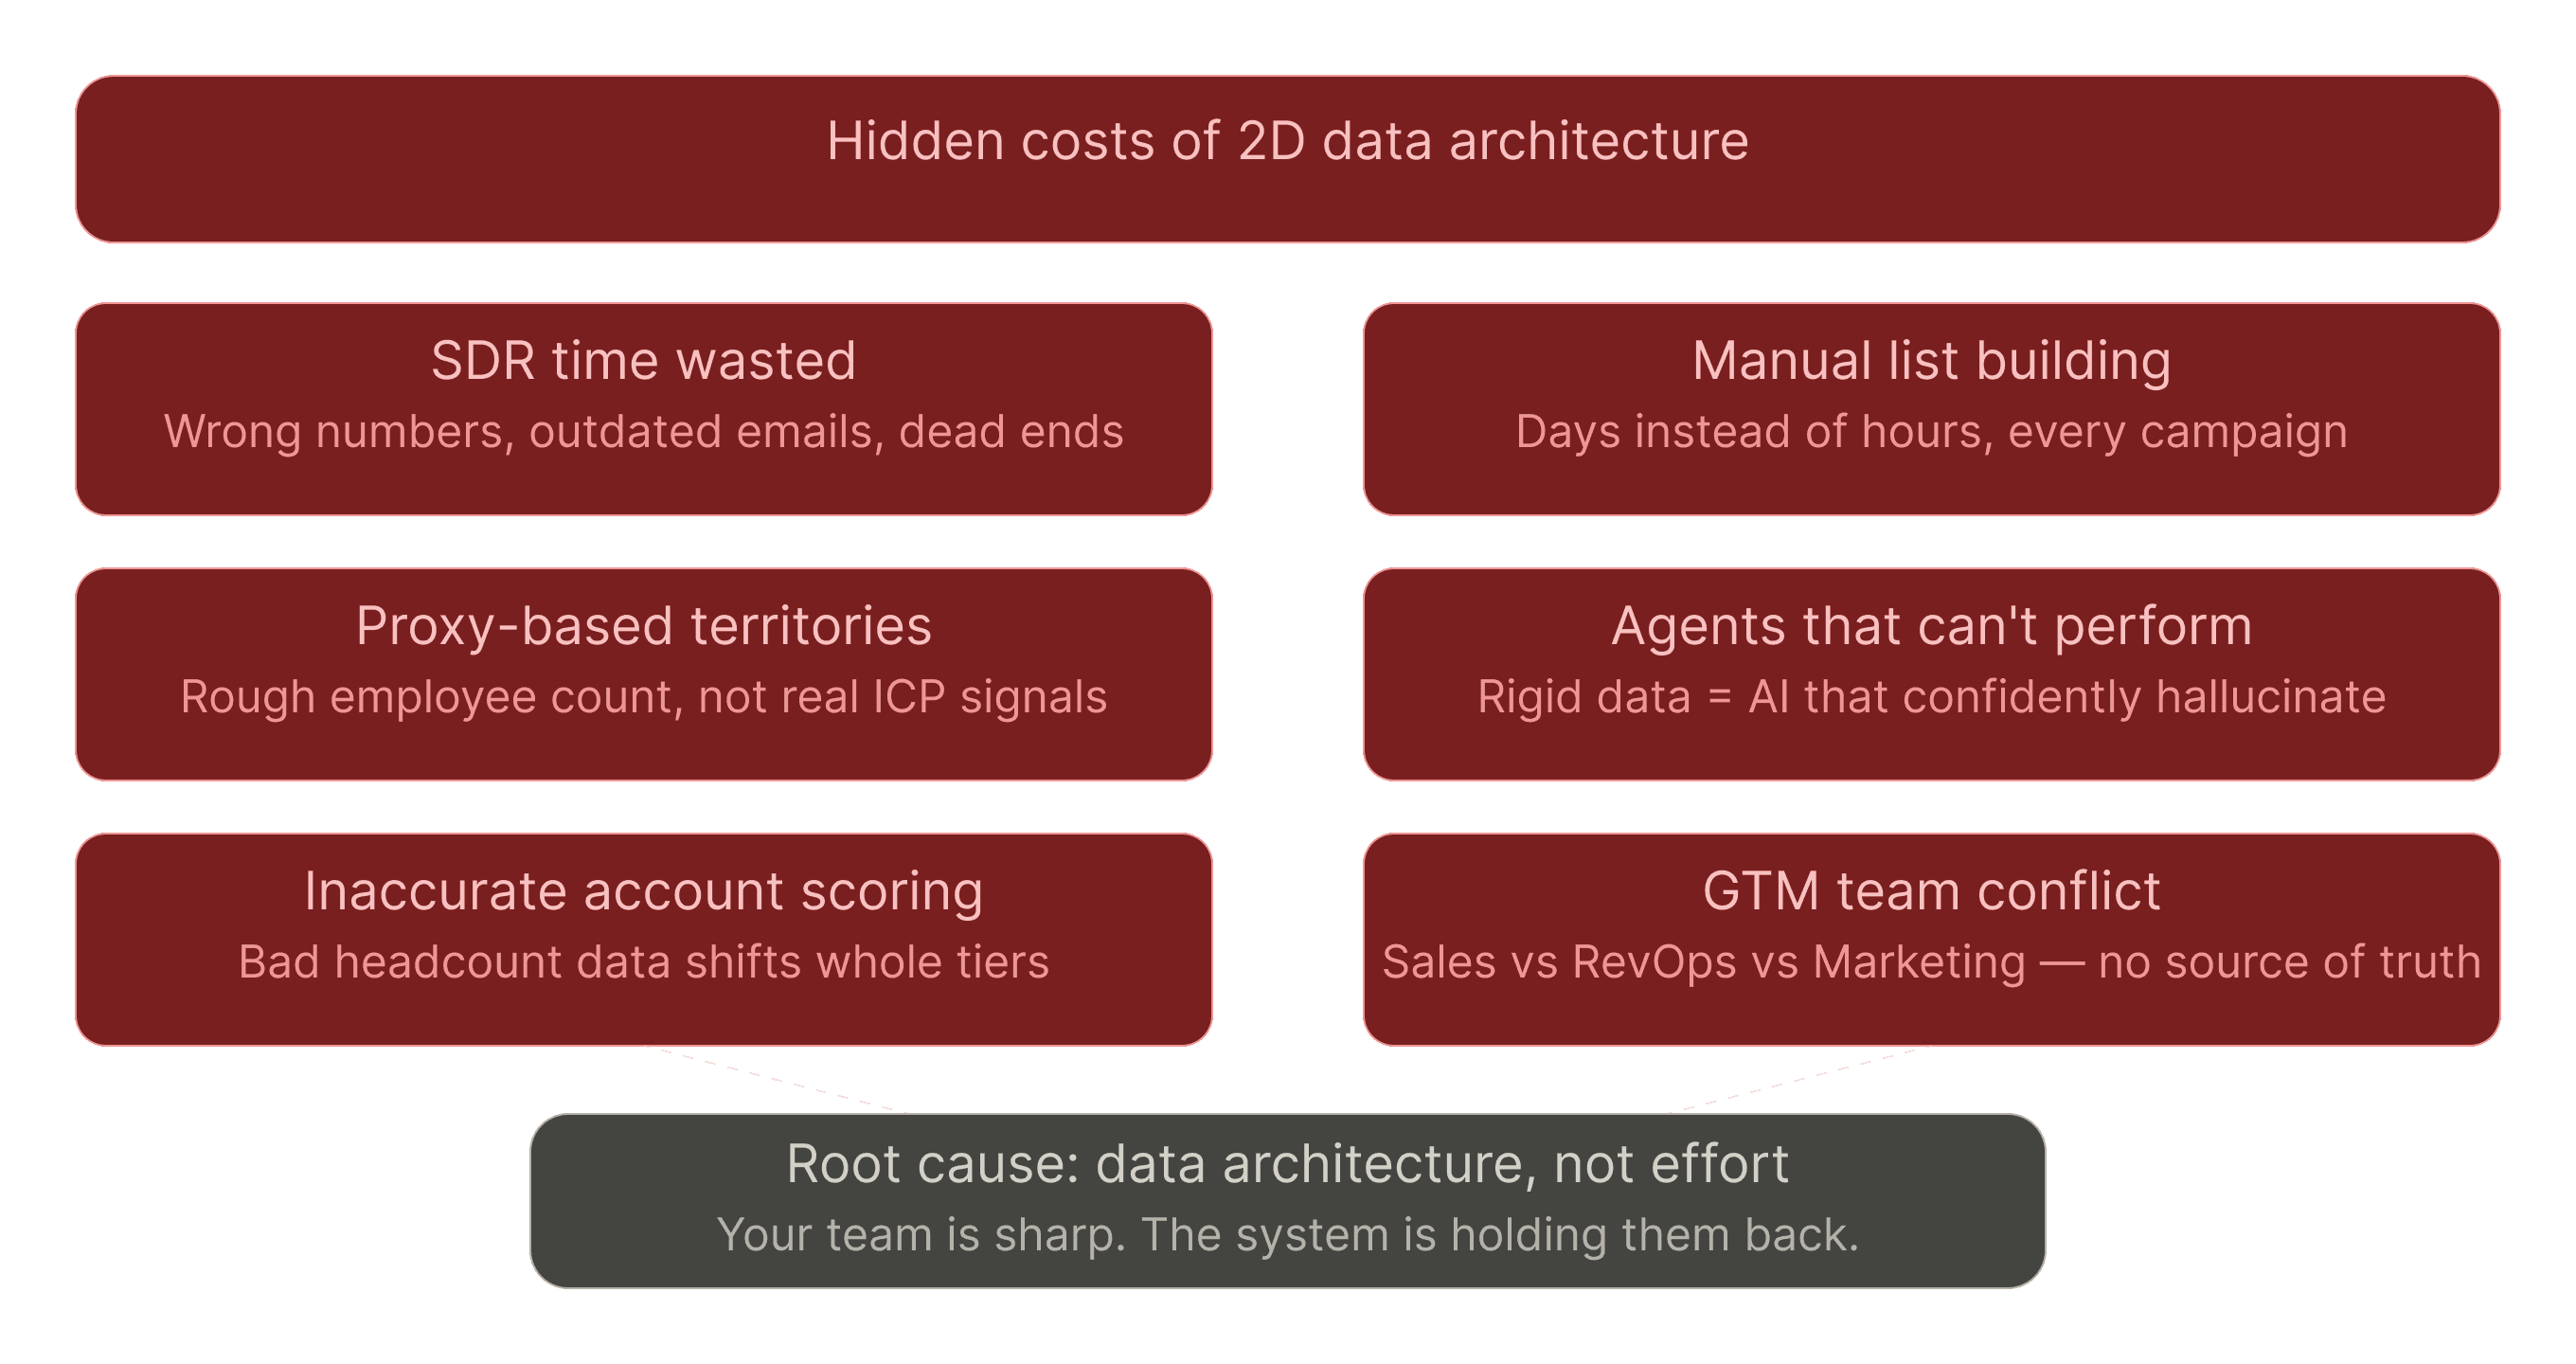
You're not losing to competitors with better reps. You're losing to competitors with a data architecture that understands context.
What to Do Next
If you're evaluating data providers, ask them this:
"Can you show me companies using competitor tech, with subsidiaries in my target regions, that just announced partnerships in adjacent verticals, and surface the VP of Engineering at each sub?"
If they say "we can get you 80% of the way there," that's a hard pass.
If they say "just set these 12 filters and export," that's a 2D answer to a 3D problem. Hell no.
The right answer is: "Let me show you how the graph pulls those non-obvious relationships in real-time. Let’s spend the next 120 seconds building this together.”
Your GTM motion needs data that thinks in dimensions, not columns. Stop embracing Larry. Stop doing V-lookups at scale. Your RevOps teams, your SDRs, your agents – hell, I’ll say even your prospects – all deserve better.
About GraphIQ: We're building the knowledge graph for go-to-market teams who are tired of duct-taping flat files together. If this resonated, let's talk. Book time here.
Sam Featherstone
VP of GTM
Share

